TLMBoy: Optimizing a SystemC/TLM-based Game Boy Emulator
Contents
1. Overview
Back in 2020, I started writing my own open-source, SystemC/TLM-based Game Boy emulator, called TLMBoy. Over the years it progressively turned into something that runs fast and supports many fancy features. One thing that I never really maxed is the emulator’s performance. I sometimes spent a bit of time on optimization if the FPS didn’t reach the original frame rate of 60 FPS, but a real performance deep dive was never conducted. Hence, the time had come to write a blog post about pushing the performance of my SystemC/TLM-based Game Boy emulator to the limit. Because of the nature of this project, the following optimizations focus much on SystemC/TLM, C++, and Linux.
2. Benchmarking
Before fiddling around in the code, you need to know where your emulator currently stands at, and what benefits your optimizations will bring. As a simple benchmark, I used an arbitrary game and executed the first 15,000,000 cycles. With the real Game Boy executing 4,194,304 cycles per second, the benchmark covers the first ~4 seconds of the boot phase. I wrapped everything in a Python script that runs the benchmark N times and outputs the median run time. Command-wise, it boils down to this:
time ./tlmboy -r ~/Games/flappyboy.gb --fps-cap=-1 --max-cycles=15000000 --headless
As an example game, I used the open-source project FlappyBoy. But since it is not leaving the boot phase, you could just use any game.
An extremely important thing about benchmarking for optimizations is to reduce execution time variance. There is a long list of annoying things that can impact the run time of a benchmark: Dynamic frequency scaling, task switching, resource occupation by other processes, and more things that are hard to anticipate. You likely cannot reduce variance to 0, but you can get close to it as described in these posts by Google Benchmark and LLVM. Among the important things is to disable address space randomization for the current session:
echo 0 | sudo tee /proc/sys/kernel/randomize_va_space
and to use a performance scheduler:
sudo cpupower frequency-set --governor performance
Even with a performance scheduler, your system may still boost frequency when under heavy load. Consequently, disable that:
echo 0 | sudo tee /sys/devices/system/cpu/cpufreq/boost # AMD
echo 1 | sudo tee /sys/devices/system/cpu/intel_pstate/no_turbo # Intel
Everything should also run on a system where the benchmark is the only process going full throttle.
Besides that, you can reduce variance even further by binding the process to a certain CPU core using taskset.
Even with all these tweaks, I saw great variances coming from SDL’s rendering.
That’s why I’m running the benchmarks with my emulator’s --headless option, which disables graphical output.
Since SDL is also not much I can change, it even helps me to focus on the important stuff.
Note that even though my emulator doesn’t give any graphical output with --headless,
the Game Boy’s graphics engine (PPU) is still completely emulated.
Unless otherwise mentioned, all benchmarks in the following are performed on an x86 Intel i5-8265U CPU running Linux Mint 22.
3. Profiling Tools
The most important part of finding bottlenecks in your software is the tools you are using. Primarily, they should help you to answer the following questions:
- Where does my software spend a lot of time?
- How do I make it faster?
For question 1, there is a ton of different tools you can use. To just name a few: perf, gprof, VTune, InSCight, Valgrind, etc. In fact, you could even use GDB and hammer Ctrl + C randomly. If there is an apparent bottleneck, you will quickly find it. In the following, I will use many of these tools to help me find bottlenecks in the TLMBoy.
Question 2, “How do I make it faster?”, is often the harder question. Sometimes there may not even be an answer to this question. Or sometimes the answer is so ugly that code readability and maintainability should be preferred. From my experience, the best tool to answer this question is either you or your LLM subscription.
In the following subsection, I’ll highlight the tools used for this little optimization project.
3.1 InSCight
The company I’m working at wrote a special, open-source SystemC kernel that includes an instrumenting profiler. An instrumenting profiler is a tool that gathers timing annotations by starting a timer whenever an action (e.g., a function) is started, and stopping that timer when that action is concluded. Frequently starting and stopping a timer may impact the software’s performance, but you get the advantage of a profiler that doesn’t miss anything. InSCight is pretty good for a first estimation of complex systems, as it shows the time spent in different SystemC modules. Getting a high-level overview is actually something other tools struggle with, because SystemC’s quick threads manipulate the call stack as we will later see. If you identified any bottlenecking modules, you can use finer-grained profilers to dig deeper. The profiler is SystemC-only, and can be enabled by linking your application against the new SystemC kernel and providing an environment variable:
INSCIGHT=1 ./tlmboy -r ~/Games/flappyboy.gb --fps-cap=-1 --max-cycles=15000000
After executing a workload, you get an SQL database (e.g., sim.56105.db) as a result that you can feed into a script or tool. To visualize the results, I used the proprietary tool InSCight GUI to get the following diagram:
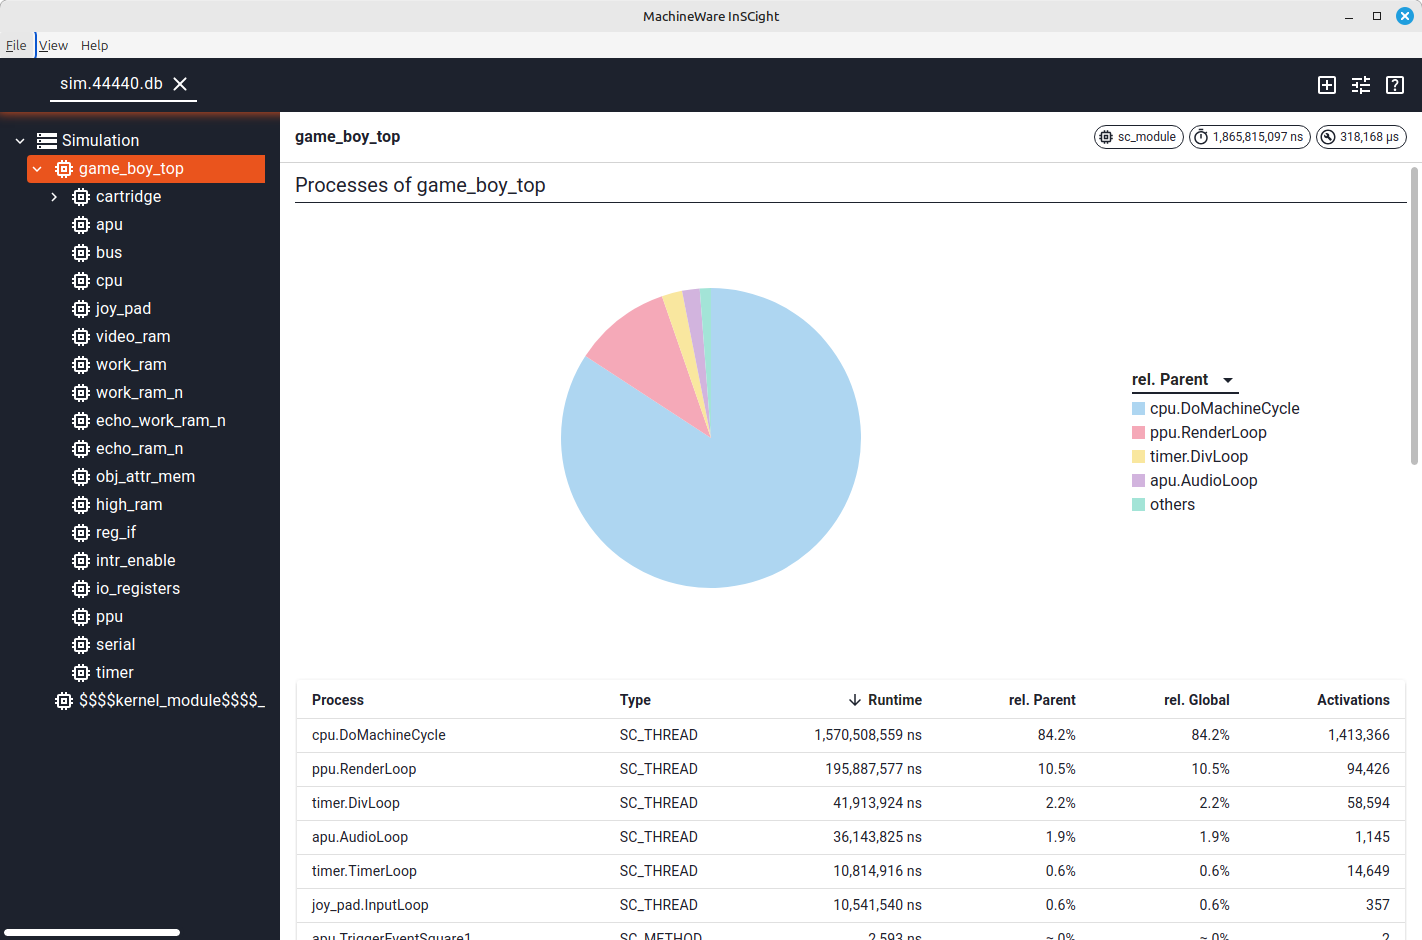
As you can see, the emulator spends most of its time (84.2%) in the CPU’s DoMachineCycle function,
which is where it fetches and executes instructions.
After that, there is the PPU’s rendering pipeline with 10.5%.
The other modules, like the timer and the APU, don’t seem to be relevant for the performance at this point.
To get the actual bottlenecks in the CPU module, we will now look at a tool called perf.
3.2 perf
An extremely powerful tool with a lot of (undocumented) features is perf. On most platforms it can be installed from the package manager with commands like:
sudo apt install linux-tools-generic linux-tools-$(uname -r)
In its default mode, perf is a so-called sampling profiler. That means, occasionally perf activates and records the current function (or call stack). While you might miss some rare events with this approach, it comes with the advantage of being lightweight and not needing to touch an application’s build flow or code. Here’s an example of using perf to profile the TLMBoy:
perf record ./tlmboy -r ~/Games/flappyboy.gb --fps-cap=-1 --max-cycles=15000000
After the execution, you should find a file called perf.data.
If you now execute perf script in the same directory, you actually see the individual events perf recorded:
> perf script
tlmboy 198573 281628.249432: 243960 cpu_core/cycles/P: 580358ad0855 Bus::b_transport(tlm::tlm_generic_payload&, sc_core::sc_time&)+0x1b5 (/build/tlmboy)
tlmboy 198573 281628.249638: 251708 cpu_core/cycles/P: 580358babd06 sc_core::sc_ppq_base::parent(int) const+0x8 (/build/tlmboy)
tlmboy 198573 281628.249850: 258486 cpu_core/cycles/P: 580358b59fe3 std::vector<sc_core::sc_thread_process*, std::allocator<sc_core::sc_thread_process*> ...
tlmboy 198573 281628.250084: 264197 cpu_core/cycles/P: 580358b2f98c Ppu::DrawBgToLine(int)+0xec (/build/tlmboy)
tlmboy 198573 281628.250329: 269048 cpu_core/cycles/P: 580358ad070d Bus::b_transport(tlm::tlm_generic_payload&, sc_core::sc_time&)+0x6d (/build/tlmboy)
Since it is hard to derive anything from such a raw representation, you can use perf report to get a better overview.
In my case, I get:
> perf report
Samples: 8K of event 'cpu_core/cycles/P', Event count (approx.): 2764117353
Overhead  Command  Shared Object  Symbol
  22,03%  tlmboy   tlmboy         [.] Bus::b_transport(tlm::tlm_generic_payload&, sc_core::sc_time&)
   3,68%  tlmboy   tlmboy         [.] sc_core::sc_simcontext::simulate(sc_core::sc_time const&)
   3,51%  tlmboy   tlmboy         [.] sc_core::sc_simcontext::crunch(bool)
   2,70%  tlmboy   tlmboy         [.] sc_core::sc_thread_process::suspend_me()
   2,57%  tlmboy   tlmboy         [.] sc_core::sc_ppq_base::heapify(int)
   2,55%  tlmboy   tlmboy         [.] sc_core::sc_notify_time_compare(void const*, void const*)
   2,47%  tlmboy   tlmboy         [.] Ppu::DrawBgToLine(int)
   1,92%  tlmboy   tlmboy         [.] sc_core::sc_event::trigger()
   1,83%  tlmboy   tlmboy         [.] sc_core::sc_thread_process::wait(sc_core::sc_time const&)
   1,79%  tlmboy   tlmboy         [.] Cpu::ReadBus(unsigned short, GbCommand::Cmd) [clone .constprop.0]
   1,75%  tlmboy   tlmboy         [.] sc_core::sc_runnable::is_empty() const
   1,41%  tlmboy   tlmboy         [.] sc_core::sc_ppq_base::insert(void*)
   1,27%  tlmboy   tlmboy         [.] sc_core::sc_time::operator<(sc_core::sc_time const&) const
   1,08%  tlmboy   tlmboy         [.] sc_core::sc_thread_process::trigger_dynamic(sc_core::sc_event*)
That’s already more meaningful! We can clearly see how the TLMBoy spends 22,03% of its time in Bus::b_transport.
And that totally makes, because it is the bus access function that the Game Boy calls to fetch each instruction.
Note that there is one very important detail I also misunderstood when using perf:
the reported time spent in the function excludes calls to child functions.
I mean it is logical, how should perf know a function is a child of another function if it did not record a callgraph graph
as we have seen from the data shown by perf script.
If you want to include the time spent in called functions, execute perf with the -g toggle:
perf record -g ./tlmboy -r ~/Games/flappyboy.gb --fps-cap=-1 --max-cycles=15000000
Now we get this output:
> perf report
Samples: 10K of event 'cpu_core/cycles/P', Event count (approx.): 3067740413
  Children      Self  Command   Shared Object  Symbol
+   36,94%     0,00%  tlmboy    tlmboy         [.] sc_main
+   36,93%     0,00%  tlmboy    [unknown]      [.] 0x73656d61472f6f6b
+   36,93%     0,00%  tlmboy    [unknown]      [.] 0x0000000000000023
+   36,92%     0,00%  tlmboy    tlmboy         [.] sc_core::sc_start(sc_core::sc_time const&, sc_core::sc_starvation_policy)
+   36,50%     2,96%  tlmboy    tlmboy         [.] sc_core::sc_simcontext::simulate(sc_core::sc_time const&)
+   20,81%     0,00%  tlmboy    [unknown]      [.] 0x900000000000841f
+   20,81%     0,00%  tlmboy    tlmboy         [.] std::_Sp_counted_ptr_inplace<tlm_utils::simple_initiator_socket<Bus, 8u, tlm::tlm_base_
+   20,30%    19,87%  tlmboy    tlmboy         [.] Bus::b_transport(tlm::tlm_generic_payload&, sc_core::sc_time&)
+   16,32%     0,00%  tlmboy    [unknown]      [k] 0000000000000000
+   15,10%     0,00%  tlmboy    [unknown]      [.] 0x000057ed8426dc90
+   14,32%     0,59%  tlmboy    tlmboy         [.] sc_core::wait(sc_core::sc_time const&, sc_core::sc_simcontext*)
+   14,18%     3,71%  tlmboy    tlmboy         [.] sc_core::sc_simcontext::crunch(bool)
+   14,10%     1,42%  tlmboy    tlmboy         [.] sc_core::sc_thread_process::wait(sc_core::sc_time const)
Note that you can press E to expand the children of an entry in the table. This view can be more telling than a trace without call stacks, but it comes with two caveats:
- There is way more data being generated than for a simple function trace.
- SystemC/TLM (the library TLMBoy builds on) uses quick threads, which alter the call stack and seem to confuse perf (see symbol
0x000057ed8426dc90for an example). This also seems to cause the percentage numbers not going up to 100%.
With the hotspot function identified, let us now take a look at the actual code and assembly. The corresponding C++ code can be found here and looks like this:
void Bus::b_transport(tlm::tlm_generic_payload& trans, sc_time& delay) {
  const u16 adr = static_cast<u16>(trans.get_address());

  for (auto slave : bus_slave_vec_) {
    if ((slave.addr_from <= adr) && (adr <= slave.addr_to)) {
      auto socket = slave.socket;
      trans.set_address(adr - slave.addr_from);
      (*socket)->b_transport(trans, delay);
      return;
    }
  }

  trans.set_response_status(tlm::TLM_ADDRESS_ERROR_RESPONSE);
}
In perf, if you press enter on the hottest row, and then hit “Annotate”, you should get to the following view:
Samples: 9K of event 'cpu_core/cycles/P', 4000 Hz, Event count (approx.): 2876743624
Bus::b_transport(tlm::tlm_generic_payload&, sc_core::sc_time&)  /build/tlmboy [Percent: local period]
Percent│       mov     %rbp,%rdi
       │       pop     %rbx
       │       pop     %rbp
       │       pop     %r12
       │       pop     %r13
       │       pop     %r14
       │       pop     %r15
       │     → jmp     48790 <std::_Sp_counted_base<(__gnu_cxx::_Lock_policy)2>::_M_release_last_use_cold()>
       │       nop
       │     { __atomic_fetch_add(__mem, __val, __ATOMIC_ACQ_REL); }
 23,89 │190:   lock    addl    $0x1,0x8(%rbp)
       │     if ((slave.addr_from <= adr) && (adr <= slave.addr_to)) {
  0,57 │       test    %al,%al
  0,74 │     ↑ je      6d
       │     if (__is_single_threaded())
       │19d:   cmpb    $0x0,__libc_single_threaded@GLIBC_2.32
The view tries to show you in which lines of code a lot of time was spent in, and what the corresponding machine code looks like. This view can be confusing if the binary was compiled with aggressive optimizations. Rescheduling, inlining, and other compiler optimizations make it hard to map a given instruction to one line of code in your source files.
As you can see in the output, the hottest instruction is lock addl that maps to a __atomic_fetch_add.
What is an atomic fetch add doing in this function?!
Well, it turns out that auto socket = slave.socket; wasn’t a good idea because it creates a copy of a thread-safe shared pointer.
If it were just a normal pointer, a good compiler could probably just do some propagation optimization,
but with shared pointers it is different.
The solution is obviously to remove this copy and directly go via slave.socket, but let us save this for the optimization section.
3.3 gperftools
As a next tool, let’s look at gperftools, which includes a sampling profiler that can create nice graphs. It can be installed by executing:
sudo apt install google-perftools libgoogle-perftools-dev
go install github.com/google/pprof@latest
In contrast to perf, it requires you to link your binary with a -lprofiler flag.
Once compiled and linked, execute your application like this:
LD_PRELOAD="/usr/lib/x86_64-linux-gnu/libprofiler.so" CPUPROFILE="bench.prof" ./tlmboy_analysis -r ~/Games/flappyboy.gb --fps-cap=-1 --max-cycles=15000000
You can get a cool call graph by executing:
~/go/bin/pprof -svg tlmboy_analysis bench.prof
Take a look at the callgraph (open it in another tab to see it as a whole):

We arrive at a similar statement as from the perf analysis, but now we can better see and understand how individual functions relate to each other.
4. Optimizing
After getting an overview of analysis tools and an initial set of bottlenecks in the TLMBoy, it is now time to optimize. In the following, I’ll start with decisions that impact your project as a whole and then progressively descend to narrower scopes.
4.1 Compiler Flags
So, let us start with a simple, but major decision: the compile flags.
Compiler flags are a somewhat dangerous territory, as aggressive optimizations may lead to longer compile times, and may break portability/functionality.
To be on the safe side, my TLMBoy still has the typical -O3 release build,
but there’s now an additional compiler target called tlmboy_fast with more fancy flags.
In particular, the fast build target uses the following compiler flags:
-O3: The standard toggle for maximum performance. For all further compiler optimizations, there is usually a catch.-march=native: Make use of CPU extensions supported by the current host system. This may impact your binary’s portability, but especially niche stuff like half-precision arithmetic can see great performance increases.-flto: Link-time optimization (LTO) enables optimizations across translation unit border at the cost of more compile time.-fcf-protection=none: We are not programming something where security plays a major role. Hence, disable these control-flow protection functions to avoid superfluous instructions like ENDBR64.
There are more performance-related toggles that I’m not using because they have a catch, and I didn’t see any performance improvement:
-ffast-math: This optimization purely targets floating point arithmetic and enables the following flags:-fno-trapping-math,-funsafe-math-optimizations,-ffinite-math-only,-fno-errno-math,-fno-signaling-nans,-fno-rounding-math,-fcx-limited-rangeand-fno-signed-zeros. The meaning of the individual flags can be found in the documentation. Basically the premise of all these flags is to break IEEE 754 compliance and thus enable optimization potential for floating point arithmetic. I have spent quite a bit of time on floating point arithmetic (see Post 1 and Post 2), and I think that most programs can use these optimizations without problems. But if problems occur, tracing them back to your fancy compiler flags can be extremely difficult. Also, if your program isn’t really floating-point heavy, it doesn’t make a difference.-fomit-frame-pointer: Allows the compiler to omit the frame pointer, maybe saving a few instructions and reducing register pressure. This may negatively impact debuggers and profiling tools.
To see how the additional compiler flags impact performance, I benchmarked my TLMBoy with a simple -O3 and with the fancy flags:
I used this script with corresponding targets, which runs a benchmark 11 times and records the run times. As you can see from the boxplot, the additional flags seem to give a median ~2.5% performance improvement. It is not much, and the distributions do overlap a bit, but more flags seem to give more performance. With this set of compiler flags, let us now take a look at how other compilers and their versions perform.
4.2 Compilers
By default, most people and CMake projects simply use the system’s default compiler, which is likely GCC. But there is also another big player around: Clang. I was wondering how much they differed in performance, so I consulted different sources in the internet, which gave me the following answers:
- This post from 2019: Clang compiles faster (5%-10%), gcc generates faster code (1%-4%).
- This post from 2023: On average, there is no difference between gcc and Clang (“[…] it ends up being an effective tie”)
- This post from 2026: “Bottom line: No universal winner.”
The general conclusion seems to be that GCC and Clang may show small benchmark- and platform-specific differences, but overall they are pretty much on par.
More important than your compiler seems to be your compiler’s version. There’s even a law called Proebsting’s Law, stating that compiler performance doubles every 18 years. That sounds overly optimistic, but let us look at some data from the internet:
- 2014 comparison of GCC-4.8, GCC-4.9, LLVM-3.3, and LLVM-3.4: More recent compilers generate faster code at the cost of more compile time.
- 2022 comparison of LLVM 11 and LLVM 2.7: “LLVM 11 tends to take 2x longer to compile code with optimizations, and as a result produces code that runs 10-20% faster (with occasional outliers in either direction), compared to LLVM 2.7, which is more than 10 years old.”.
- 2026 comparison of GCC 16 anbd GCC 15: There are a couple of outliers, but overall GCC 16 outperforms GCC 15.
The general consensus seems to be that more recent versions do actually give you slightly more performance, but it is not a magical “fix my slow code” spell.
Since every system and every application is different, let us see how Clang and GCC compare when compiling the TLMBoy. Using this Python benchmark script, I got the following results:
As you can see, different versions of Clang continuously outperform GCC, with the best Clang outperforming the worst GCC by ~5%. Also, the general observation that more recent compilers give you more performance seems to hold true. Except for clang-20, all compiler versions outperform their predecessors. That means, the optimal compiler for the TLMBoy seems to be clang-19.
To conclude, just by using clang-19 and more advanced flags, the median benchmark time was improved from 1127 ms to 1036 ms, which is a 8.5% performance gain. After having sorted out the general project settings, it is now time to optimize the code.
4.3 Code Changes
4.3.1 b_transport
As already discussed in the section about perf, the bus b_transport needs to avoid copying the shared pointer.
Including a small reference iterator change, the optimized function now looks like:
void Bus::b_transport(tlm::tlm_generic_payload& trans, sc_time& delay) {
  const u16 adr = static_cast<u16>(trans.get_address());

  for (const auto& slave : bus_slave_vec_) {
    if ((slave.addr_from <= adr) && (adr <= slave.addr_to)) {
      trans.set_address(adr - slave.addr_from);
      (*slave.socket)->b_transport(trans, delay);
      return;
    }
  }

  trans.set_response_status(tlm::TLM_ADDRESS_ERROR_RESPONSE);
}
Iterating linearly over all bus slaves may indicate some room for optimization, but keep in mind that there are only 15 bus slaves. Furthermore, the hot load/store targets like the cartridge and working RAM are located directly at the vector’s start. With the changes in place, it was time to benchmark again:
As you can see, the median benchmark time was improved from 1042 ms to 773 ms. After that optimization, I perfed again to get the following data:
+   46,65%  0,00%  tlmboy_fast  [unknown]     [k] 0000000000000000
+   22,34%  0,00%  tlmboy_fast  [unknown]     [.] 0x00000000129a7bc0
+   11,67%  0,00%  tlmboy_fast  [unknown]     [.] 0x8b4c08ec8348f589
+   11,67%  0,00%  tlmboy_fast  tlmboy_fast   [.] sc_core::sc_object::dump(std::ostream&) const
+    9,16%  8,97%  tlmboy_fast  tlmboy_fast   [.] Cpu::DoMachineCycle()
+    8,53%  7,59%  tlmboy_fast  tlmboy_fast   [.] Cpu::ReadBus(unsigned short, GbCommand::Cmd)
+    8,46%  8,46%  tlmboy_fast  tlmboy_fast   [.] Bus::b_transport(tlm::tlm_generic_payload&, sc_core::sc_time&)
+    8,39%  6,99%  tlmboy_fast  tlmboy_fast   [.] sc_core::sc_simcontext::crunch(bool)
+    8,23%  6,72%  tlmboy_fast  tlmboy_fast   [.] sc_core::wait(sc_core::sc_time const&, sc_core::sc_simcontext*)
+    7,09%  7,02%  tlmboy_fast  tlmboy_fast   [.] sc_core::sc_simcontext::simulate(sc_core::sc_time const&)
+    5,05%  5,05%  tlmboy_fast  tlmboy_fast   [.] tlm_utils::simple_target_socket_b<GenericMemory, 8u, tlm::tlm_base_protocol_types, (sc_core::sc_port_policy)0>::fw_process::b_transport(...)
+    4,32%  4,32%  tlmboy_fast tlmboy_fast    [.] tlm_utils::simple_target_socket_b<Cartridge::MemoryBankCtrler, 8u, tlm::tlm_base_protocol_types, (sc_core::sc_port_policy)0>::fw_process::b_transport(...)
Now the process repeats again: take a promising function and try to improve it.
In my case, I went for sc_core::wait because I already knew that the CPU was calling it for each instruction and I had an idea of how it could be improved.
4.3.2 Dynamic Quantum
If you are developing a SystemC/TLM-based virtual platform, there are likely many calls to sc_core::wait in your code.
Even though it is one of the library’s core functions, its use should be avoided whenever possible.
Each call deschedules the current SystemC thread, which can be expensive in terms of performance due to SystemC’s coroutine semantics.
Luckily, SystemC offers a solution to avoid frequent calls to sc_core::wait: temporal decoupling.
The idea of temporal decoupling is to advance a thread’s local time without synchronizing with the rest of the system for a given time called: quantum.
Since you are fumbling with the system’s timing semantics, you may impact or even break the functionality of the system.
Most software on modern systems doesn’t really require exact timings, and doesn’t really care if, for example, a timer fires a few microseconds too late.
Unfortunately, the Game Boy from 1989 isn’t modern and cares about exact timings, so classic temporal decoupling wasn’t an option…
But I had an idea: What if I could get the time of the next event in the future and skip all wait calls until this point?
For example, if I knew the next timer event was in 100 µs, I could just let the CPU run to that point without calling sc_core::wait
(assuming no other events were scheduled in the meantime).
Let me show you what that means in code:
// The following code is part of the CPUs main loop:
local_time_delta_ += sc_time(wait_ns_, sc_core::SC_NS);
auto time_limit = sc_time_to_pending_activity();
auto max_time = sc_max_time() - sc_time_stamp();
if ((time_limit <= local_time_delta_) || (time_limit == max_time)) {
  wait(local_time_delta_);
  local_time_delta_ = sc_time(0, sc_core::SC_NS);
}
Before I added this code, each CPU instruction would call sc_wait with a corresponding cycle time.
Now each instruction annotates its timing in an integer wait_ns_ instead.
This is added to the local_time_delta_.
If the local_time_delta_ would exceed the time to the next event, sc_core::wait is called.
During testing I noticed that the end of a simulation isn’t really counted as an event.
If you started the simulation with sc_start(25, SC_NS), sc_time_to_pending_activity() would still return the maximum delta.
To take this into acount, the CPU also calls sc_core::wait if there’s no event in the future.
Luckily, that never happens except for a few unit tests, where no peripherals are included.
After implementing the changes, I ran the benchmarks again to get:
Pretty neat! The dynamic quantum approach, or whatever you would call this, reduced the benchmark time by 30%.
After this change, let us do another iteration of analyze and optimize:
+   27,43%   0,00%  tlmboy_fast  [unknown]    [k] 0000000000000000
+   23,03%   0,00%  tlmboy_fast  [unknown]    [k] 0x0000000000522400
+   14,51%   0,00%  tlmboy_fast  [unknown]    [.] 0x0000000000841f0f
+   14,51%   0,00%  tlmboy_fast  tlmboy_fast  [.] sc_core::sc_interface::default_event() const
+   12,89%  12,31%  tlmboy_fast  tlmboy_fast  [.] Bus::b_transport(tlm::tlm_generic_payload&, sc_core::sc_time&)
+    9,24%   0,00%  tlmboy_fast  tlmboy_fast  [.] sc_core::sc_thread_cor_fn(void*)
+    8,64%   8,18%  tlmboy_fast  tlmboy_fast  [.] Cpu::DoMachineCycle()
+    8,54%   8,42%  tlmboy_fast  tlmboy_fast  [.] Ppu::RenderLoop()
+    8,46%   8,29%  tlmboy_fast  tlmboy_fast  [.] tlm_utils::simple_target_socket_b<GenericMemory, 8u, ...>::fw_process::b_transport(...) [clone .lto_priv.0]
+    7,30%   6,48%  tlmboy_fast  tlmboy_fast  [.] Cpu::ReadBus(unsigned short, GbCommand::Cmd) [clone .constprop.0]
+    7,01%   0,00%  tlmboy_fast  [unknown]    [.] 0x0000000000501208
+    6,24%   6,24%  tlmboy_fast  tlmboy_fast  [.] tlm_utils::simple_target_socket_b<Cartridge::MemoryBankCtrler, 8u, ...0>::fw_process::b_transport(...) [clone .lto_priv.0]
+    5,19%   4,66%  tlmboy_fast  tlmboy_fast  [.] Cartridge::Mbc1::b_transport_rom(tlm::tlm_generic_payload&, sc_core::sc_time&)
A top candidate is again Bus::b_transport, so let us see how this can be optimized further.
4.3.3 Direct Memory Interface
Generally in SystemC, the b_transport is a simple, reliable, but slow way of performing a transport.
The SystemC designers already anticipated that and also introduced the Direct Memory Interface (DMI) in their standard.
The idea of DMI is to request pointers from other modules,
which a module can then use to work on the data without requiring constant b_transport accesses.
Such an approach can only work if reading/writing doesn’t cause any side effects (e.g., interrupts).
For the Game Boy, these conditions are met for reading parts of the cartridge.
Hence, I added a DMI path for reading data from the cartridge in this commit.
Note that the current approach only implements a DMI path for the lower, fixed part of the cartridge.
The upper part can be bank-switched, which would require an invalidation path.
With DMI implemented, I get the following result:
And another big chunk (39%) of time was saved and the benchmark time is now down to 327 ms!
4.3.4 NDEBUG
While I was browsing through the code looking for potential optimizations, I stumbled across something I somehow oversaw: asserts. They are all over the code, and make sure that you get a warning if parts don’t behave correctly. For example, a bank index exceeding the number of banks may be hard to detect without an assertion:
void Cartridge::BankSwitchedMem::DoBankSwitch(u8 index) {
  assert(index < num_banks_);
  bank_data_ = &data_[index * bank_size_];
  current_bank_ind_ = index;
}
They can be useful for debugging and developing, but they have no business in ultra-fast applications.
As described here, defining the macro NDEBUG skips the assert check, likely saving you a few instructions.
In theory, CMake automatically defines this macro for release builds,
but since I’m not using the CMake build type variable, the asserts managed to sneak into the fast target.
Note that it doesn’t need to be your code using asserts; asserts in other third-party library headers, like SystemC, are not unheard of.
So, after adding a -DNDEBUG compile flag, I benchmarked again to get this result:
The result was not what I was hoping for. The difference is very small, but apparently removing the asserts made my code slower?! There could be a thousand explanations for this, like different machine code alignment, compiler heuristics that produced different results, Joe Biden hacking my computer, and whatnot. But since I only removed instructions, the important questions to ask are: Are the binaries smaller? Are less instructions executed? First, I compared the binary sizes:
- Before
NDEBUG: 6,145,784 B - After
NDEBUG: 6,115,024 B
That’s the first hint. NDEBUG seems to be working as expected, leading to smaller binary sizes.
Next, let us check if fewer instructions are executed by using perf stat, which also provides a few other cool statistics:
# Without NDEBUG
> perf stat taskset -c 2 ../bm/tlmboy_dmi -r /home/niko/Games/flappyboy.gb --fps-cap=-1 --max-cycles=15000000 --headless
    288,76 msec task-clock            #    0,828 CPUs utilized
        368      context-switches     #    1,274 K/sec
          1      cpu-migrations       #    3,463 /sec
        785      page-faults          #    2,719 K/sec
459.488.830      cycles               #    1,591 GHz
972.007.511      instructions         #    2,12  insn per cycle
168.722.476      branches             #  584,307 M/sec
  3.060.556      branch-misses        #    1,81% of all branches

# With NDEBUG
> perf stat taskset -c 2 ../bm/tlmboy_ndebug -r /home/niko/Games/flappyboy.gb --fps-cap=-1 --max-cycles=15000000 --headless
304,27 msec task-clock                #    0,837 CPUs utilized
        385      context-switches     #    1,265 K/sec
          1      cpu-migrations       #    3,287 /sec
        786      page-faults          #    2,583 K/sec
483.978.227      cycles               #    1,591 GHz
970.808.404      instructions         #    2,01  insn per cycle
167.889.242      branches             #  551,785 M/sec
  3.071.835      branch-misses        #    1,83% of all branches
A few things were changing from run to run, but the following things were consistent:
- With
NDEBUGexecuted fewer instructions and branches as expected. - With
NDEBUGalways had one more page fault, which seems to point to some uncontrollable compiler magic artifact.
To conclude, even though my change led to some small, random performance penalty, the fewer executed instructions showed that I was on the right track! After this little excursion in overseen macro definitions, I again focused on analyzing and fixing hotspots provided by perf:
   72,03%     0,00%  tlmboy_fast    [unknown]                [k] 0000000000000000
+   28,99%     0,00%  tlmboy_fast    [unknown]                [.] 0x0000000000512bc0
+   16,08%    14,82%  tlmboy_fast    tlmboy_fast              [.] Cpu::DoMachineCycle()
+   10,31%    10,23%  tlmboy_fast    tlmboy_fast              [.] Ppu::RenderLoop()
+    9,51%     9,04%  tlmboy_fast    tlmboy_fast              [.] sc_core::sc_time::sc_time(double, sc_core::sc_time_unit)
One thing that’s curious, is 9.5% time spent in in the sc_time constructor.
Let us see how that can be fixed.
4.3.5 sc_time
If there is so much time spent in the sc_time constructor, there can only be 3 explanations:
- The
sc_timeconstructor is inefficient. - A lot of
sc_timeobjects are created. - All of the above.
So, first let us look at the constructor.
Although the underlying type of sc_time is just a 64-bit integer,
the constructor is a hot mess with a lot of stuff happening, including a floating-point division.
To see it with your own eyes, take a look at the official Accellera SystemC source code.
Luckily, the copy constructor is quite simple, just copying the internal 64-bit value to another object without a lot of sidequesting.
The standard also provides a predefined zero-time object called SC_ZERO_TIME,
which should actually be preferred for initializing zero times.
I used this object to initialize all zero times in the code as follows:
sc_time delay(0.0, SC_NS); // Before: calls slow constructor
sc_time delay = SC_ZERO_TIME; // After: calls faster copy constructor
Even with that, I noticed that there are still plenty sc_time objects being created by the standard constructor.
From a little bit of debugging, it turns out that calling wait(time, sc_core::SC_NS) internally creates an sc_time object.
Hence, I replaced all statements with fixed times by waits with pre-defined sc_time objects:
// Before: creates sc_time object
wait(256, sc_core::SC_NS);

// After: copy by reference
const sc_time time(256, sc_core::SC_NS);
wait(time);
That of course only makes sense if you move the sc_time constructor somewhere out of your code’s hot path.
For sc_time objects that need to be constructed quite often with different inputs in your hot path,
I preferred to use the from_value function, which is more lightweight than the constructor:
// Before: constructor uses expensive floating-point arithmetic
// to convert the double to internal ticks.
sc_time time(nanoseconds_double, SC_NS);

// After: Set the internal ticks directly.
sc_time time = sc_time::from_value(nanoseconds_int);
sc_set_time_resolution(1.0, SC_NS); // Requires this in elaboration phase.
Note that this approach requires precise knowledge and control of SystemC’s time resolution. Just to make sure my changes are sensible, I quickly benchmarked them with Google Benchmark and a little benchmark file:
--------------------------------------------------------------
Benchmark                    Time        CPU       Iterations
--------------------------------------------------------------
BM_sc_time_constructor       29.9 ns    29.9 ns    24749773
BM_sc_time_from_value        21.9 ns    21.9 ns    31082356
BM_sc_time_copy_constructor  1.94 ns    1.94 ns    366072516
Looks good, so let us see how this transfers to system performance:
16 ms faster and now down to 316 ms! Maybe an interesting sidenote: I executed this benchmark with and without the NDEBUG change from the previous subsection, and I got way better results with asserts being disabled. Consequently, I was moving in the right direction, but some kind of compiler anomaly made it hard to evaluate.
5. Conclusion
After all these optimizations from compiler flags to direct memory interfaces, let us look at where my TLMBoy started and where it is now:
As you can see in the graph, each step resulted in better performance, with some providing more benefits like the DMI optimization, and others, like the compiler flags, being just a little tweak. Overall, my Game Boy emulator is now 3.55x faster in that benchmark! To see how this translates in actual game performance, I launched Pokémon Red (see window title):

Splendid, I can finally play my favorite turn-based strategy game with 900 FPS! Jokes aside, more performance is always better, even if it is just for the sake of a faster CI pipeline (after all these changes, the TLMBoy CI tests executed 40 seconds faster 😎).